Doppler Measurements
- Optimize 2D image, adjust gain and depth
- Select the type of Doppler (Pulsed, Continuous, Tissue)
- Activates cursor
- Line cursor parallel to flow
- If PW, place indicator ball/double has in area of interest
- Select type of Doppler again to obtain signal
- Acquire waveform, wait 3-5 seconds
- Freeze waveform
- Adjust baseline and scale to optimize waveform (see tip of waveform of interest)
- Scroll through sample to find best representation
- Save image with no measurement (allow for offline measurements)
- If difficult image, save and repeat above a few times
- It is good to have several samples if needed
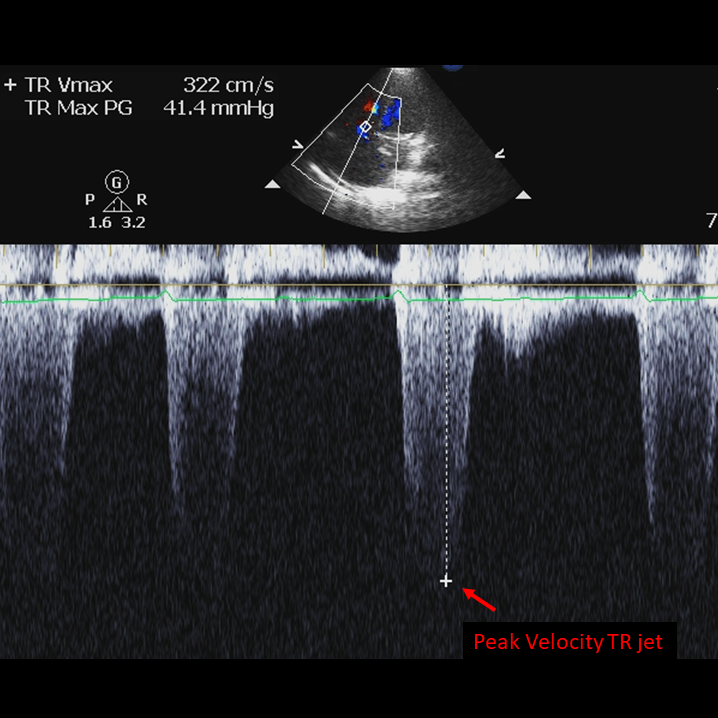
- Two primary measurements, peak velocity (V pk) and velocity time integral (VTI)
- V pk is the distance from the baseline to the tip of the curve
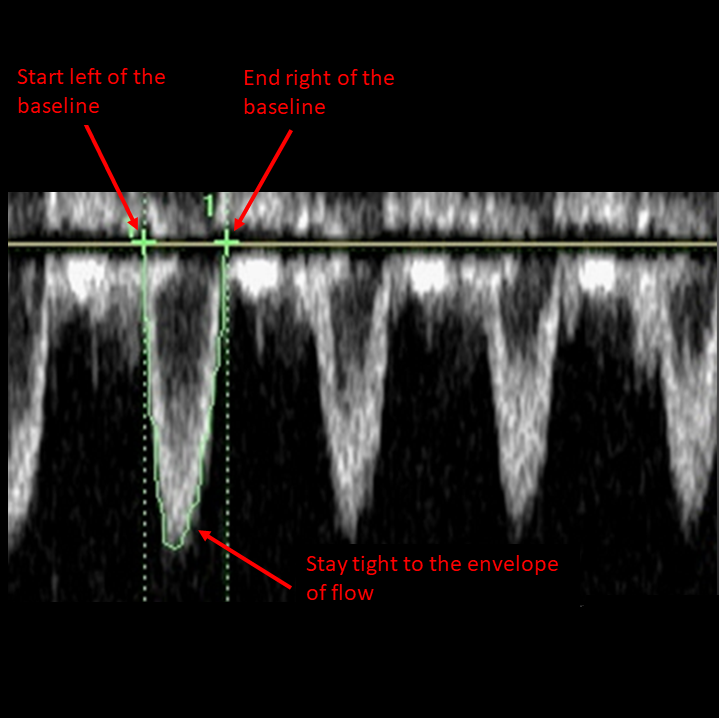
- VTI is the sum of distances under the curve
- Visual assessment of the waveform pattern for hepatic, portal and renal assessments
- Optimize frozen waveform (increase gain if needed to see full wave, and adjust scale and baseline to see entire wave)
- Spend a few seconds to make sure you know which wave is the one of interest
- Select correct measurement from calculation package
- Mark the peak of the wave and select enter
- System knows where the baseline is
- Save measurement
- Start at the baseline to the left of the curve
- Trace along the edge of the curve
- Stay tight to the curve
- Follow it down to the right side of the curve
- Select enter
- Save image
There will be some differences between systems, but they all work in the same basic way