Stroke Volume Variation
- Obtain a PSLAX view and measure the LVOT.
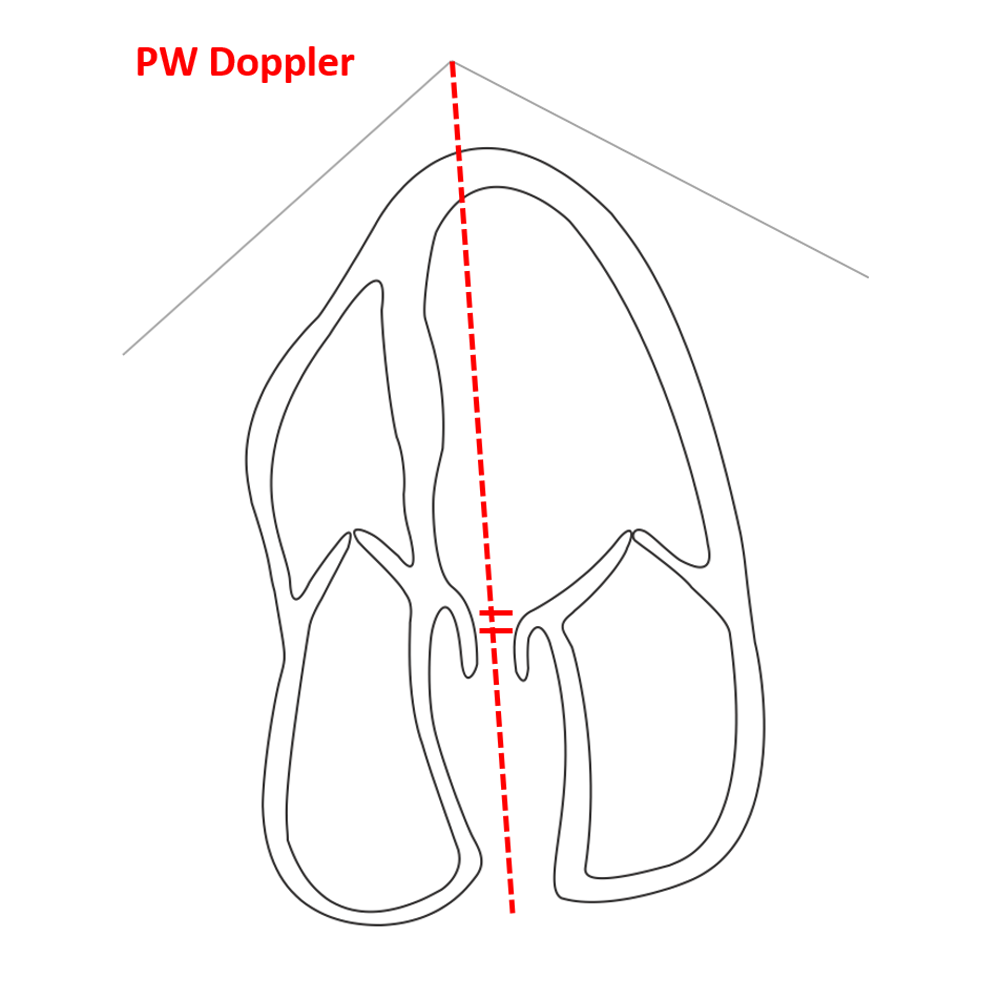
- Obtain the apical 5 chamber view.
- In pulse wave doppler, place the cursor through the outflow tract with the marker just proximal to the aortic leaflets.
- Visualize the VTI waveform over 10 to 15 respirations.
- Decrease the sweep speed to visualize an increased amount of respiratory cycles.
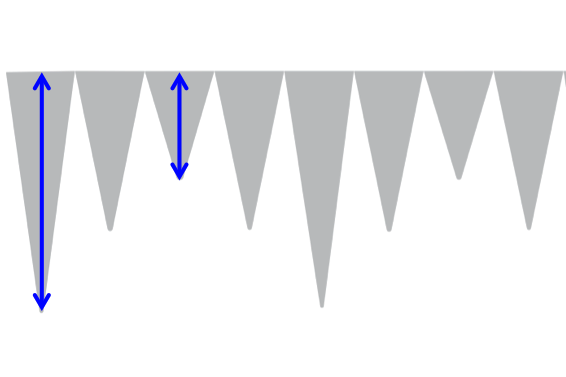
- Measure the tip of the largest and smallest waveform.
- Make sure to measure respiratory variation and not irregular beats.
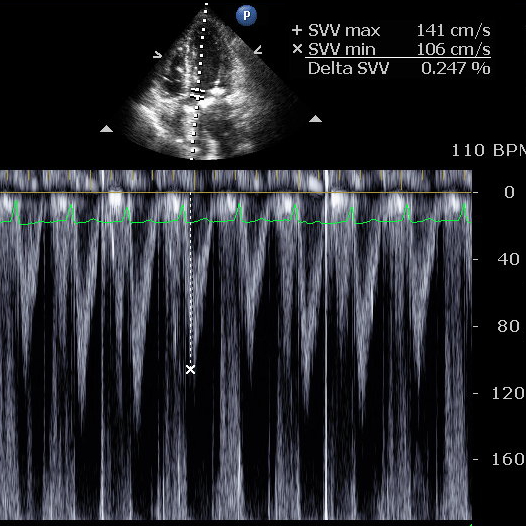
Calculate the percent change of the largest to smallest waveform
A Change of 12% or more shows potential responsiveness to fluid in patients with normal systolic cardiac function and normal sinus rhythm
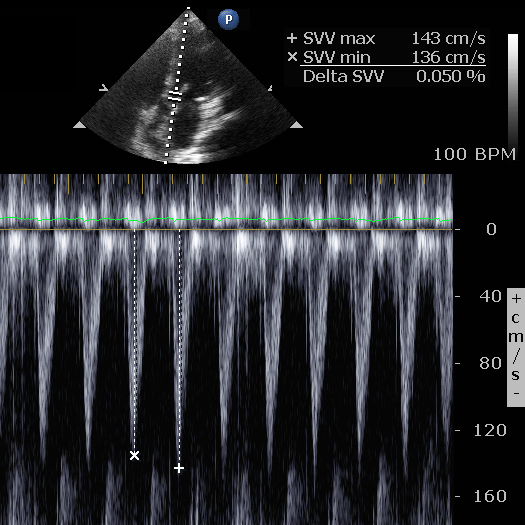
- less than 10% volume responsiveness less likely
- 10-15% indeterminant
- more than 15% volume responsiveness more likely
The pulse wave cursor should not pass through the septum of the heart
If the velocities are very high and aliasing it may be impossible to assess SVV
SVV is an unreliable tool to access volume responsiveness in patients with systolic LV dysfunction, right heart failure and arrhythmias such as AFib.
Figure 1 - Stroke Volume Variation, A5C View
Figure 2 - Stroke Volume Variation Measurment
Figure 3 - Stroke Volume Variation < 10%